Count the number of nuclei in a field
This is relatively easy as nuclei tend to be fairly well separated, similar in size and brightly stained.
Open the image and if required split channels
Threshold the image - Ctrl+Shift+T - choosing an optimal value which makes each nucleus has a single region highlighted
Analyze/Analyze particles
Here I have set a size discrimination of over >200 px to miss out the little things that aren't nuclei. Overlay outlines gives a nice output to check the accuracy of the process. "Display results" means numbers pop up in table. "Clear results" removes previous measurements, which helps to reduce the chance of errors. "Summarize" gives you a little pop up with the total number.
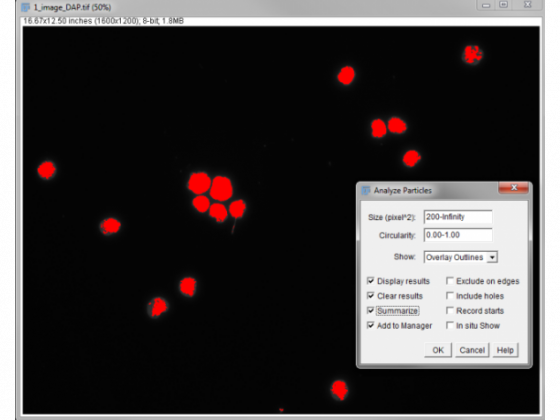
After pressing OK we count 15, which looks right . . .
If the nuclei are crowded and touching you might have to do a little more work to get to this point.
Smoothing the image - Ctrl+Shift+S or Process/Smooth - can help with the next step
Threshold the image - Ctrl+Shift+T - choosing an value which covers the nuclei well even if some touch.
Binarize - Process/Binary/Make Binary
Watershed - Separate objects at Process/Binary/Watershed
Run analyze particles using this image - The smoothing and lower threshold may give a better outline of the nucleus as well as help with touching objects.
Count the number of foci
Open the foci image
Process/Find Maxima
Adjust the noise tolerance to get a good count. Toggling the "preview point selection" is a good way of assessing this.
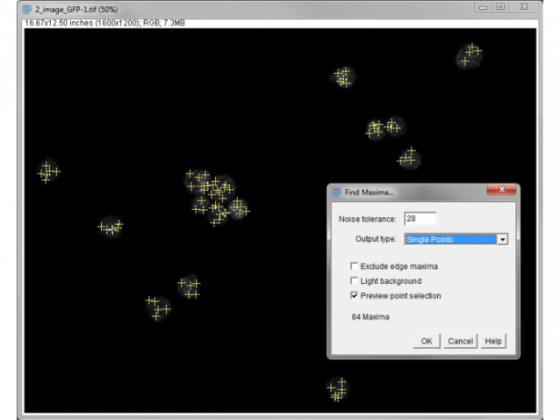
Here we have 84 spots between the 15 nuclei so an average of 5.6 per cell.
If you want the number of foci in each nucleus . . .
This obviously may present some useful information and may be worth the extra steps . . .
When you click OK above with the output type of "Single points" a new binary image is generated with a single pixel for each local maxima.
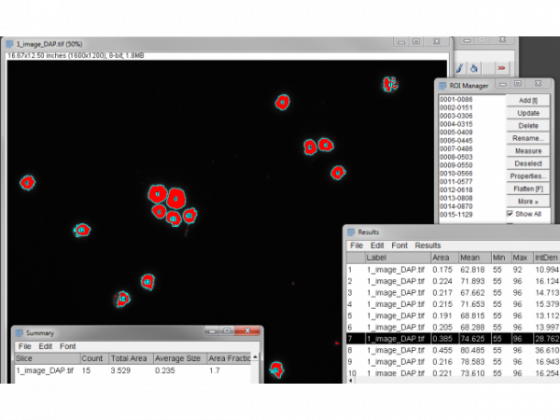
Open the ROI manager - Analyze/Tools/ROI Manager . . .
This will access the ROI shapes we made by Analyze Particles above
Check Show All - Uncheck and recheck it is already
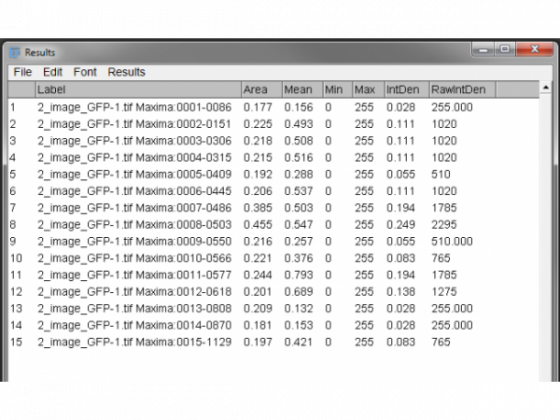
Measure from the ROI manager menu button

The results are then presented for the ROI by ROI measurement. The useful output is RawIntDen - the sum of all the pixels in that region. (If this doesn't show up, you can change what is measured under Analyze/Set Measurements). Each pixel representing a maxima will have the value of 255 so dividing the total by 255 will give you the number of detected maxima/foci in each region defined by the nuclear stain. So here we range from 1 to 9.